现有的Kubernetes集群使用Prometheus-Operator做监控,它通过Kubernetes的CRD(Custom Resource Definition,自定义资源定义)对Prometheus和Prometheus需要监控的服务进行部署和配置。
Prometheus-Operator使用下面两种资源来配置Prometheus及其要监控的服务。
- Prometheus:为Prometheus的deployment。
- ServiceMonitor:用于描述Prometheus监控的服务。
首先我们先来了解下 Prometheus-Operator 的架构图:
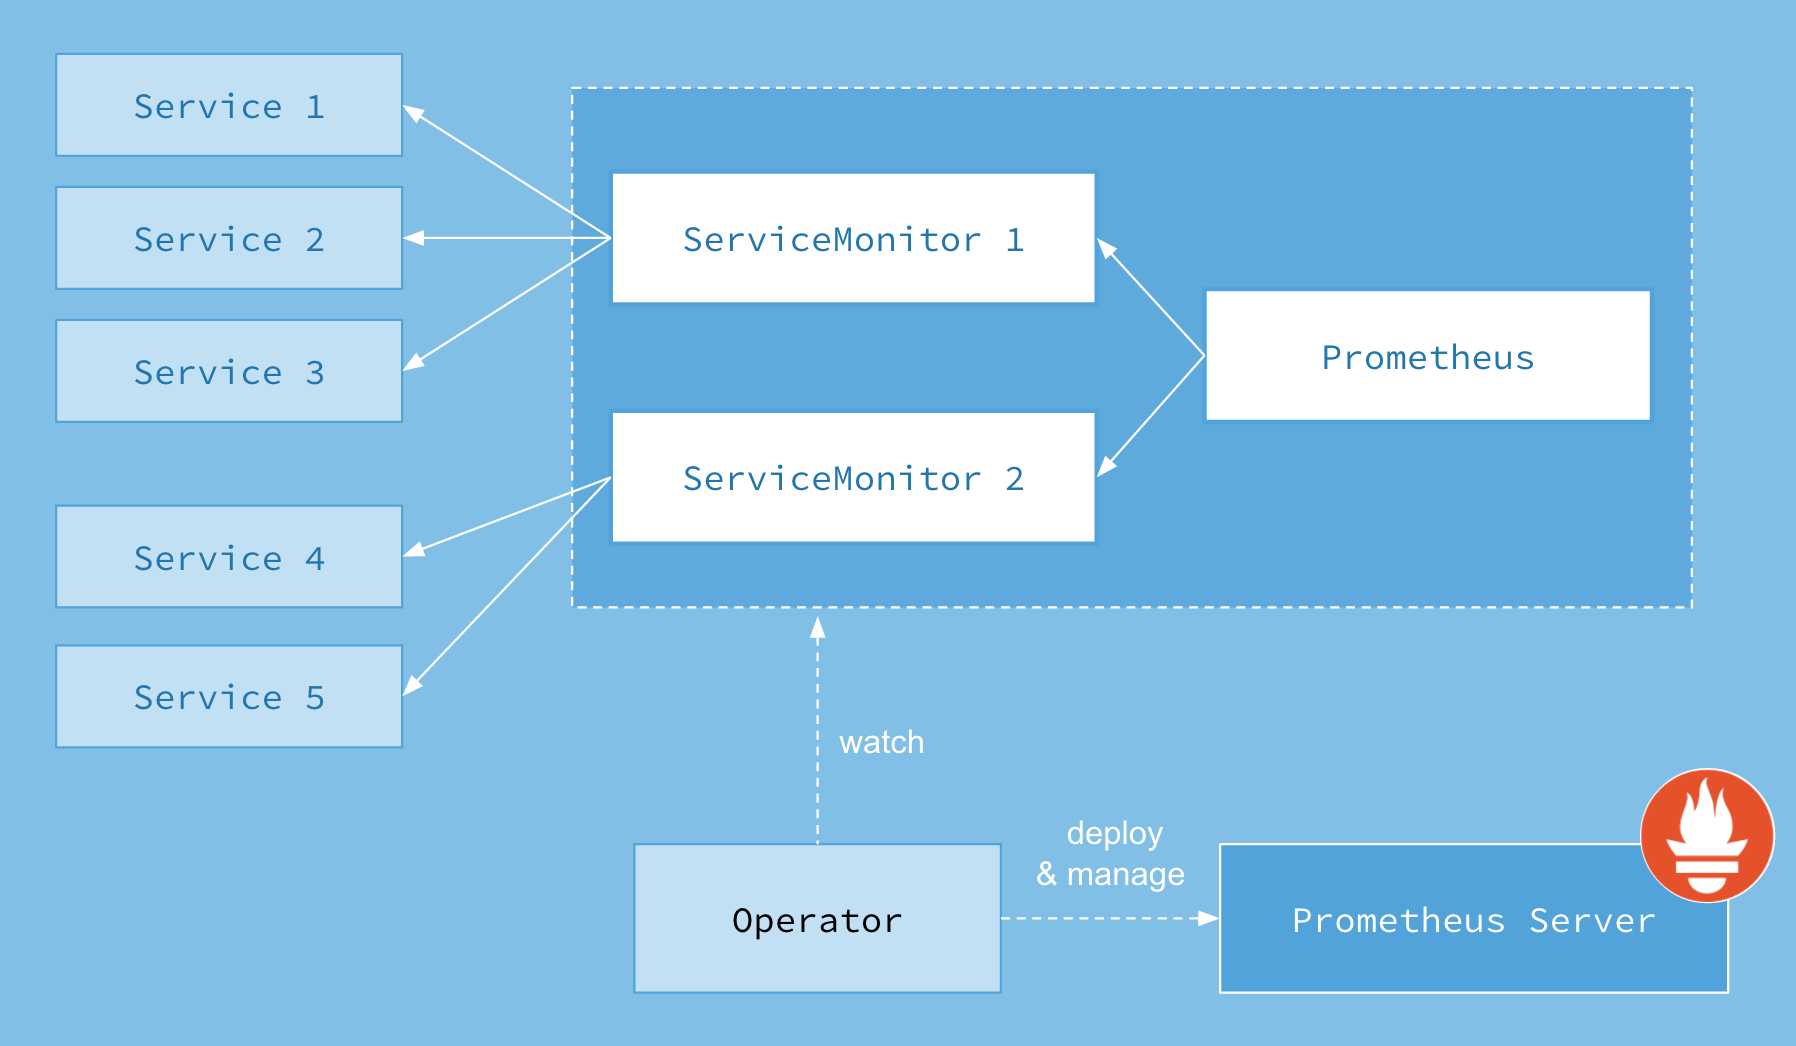 上图是 Prometheus-Operator 官方提供的架构图,其中 Operator 是最核心的部分,作为一个控制器,他会去创建 Prometheus 、 ServiceMonitor 、 AlertManager 以及 PrometheusRule 4个 CRD 资源对象,然后会一直监控并维持这4个资源对象的状态。
其中创建的 prometheus 这种资源对象就是作为 Prometheus Server 存在,而 ServiceMonitor 就是 exporter 的各种抽象, exporter是用来提供专门提供 metrics 数据接口的工具, Prometheus 就是通过 ServiceMonitor 提供的 metrics 数据接口去 pull 数据的。
当然 alertmanager 这种资源对象就是对应的 AlertManager 的抽象,而 PrometheusRule 是用来被 Prometheus 实例使用的报警规则文件。
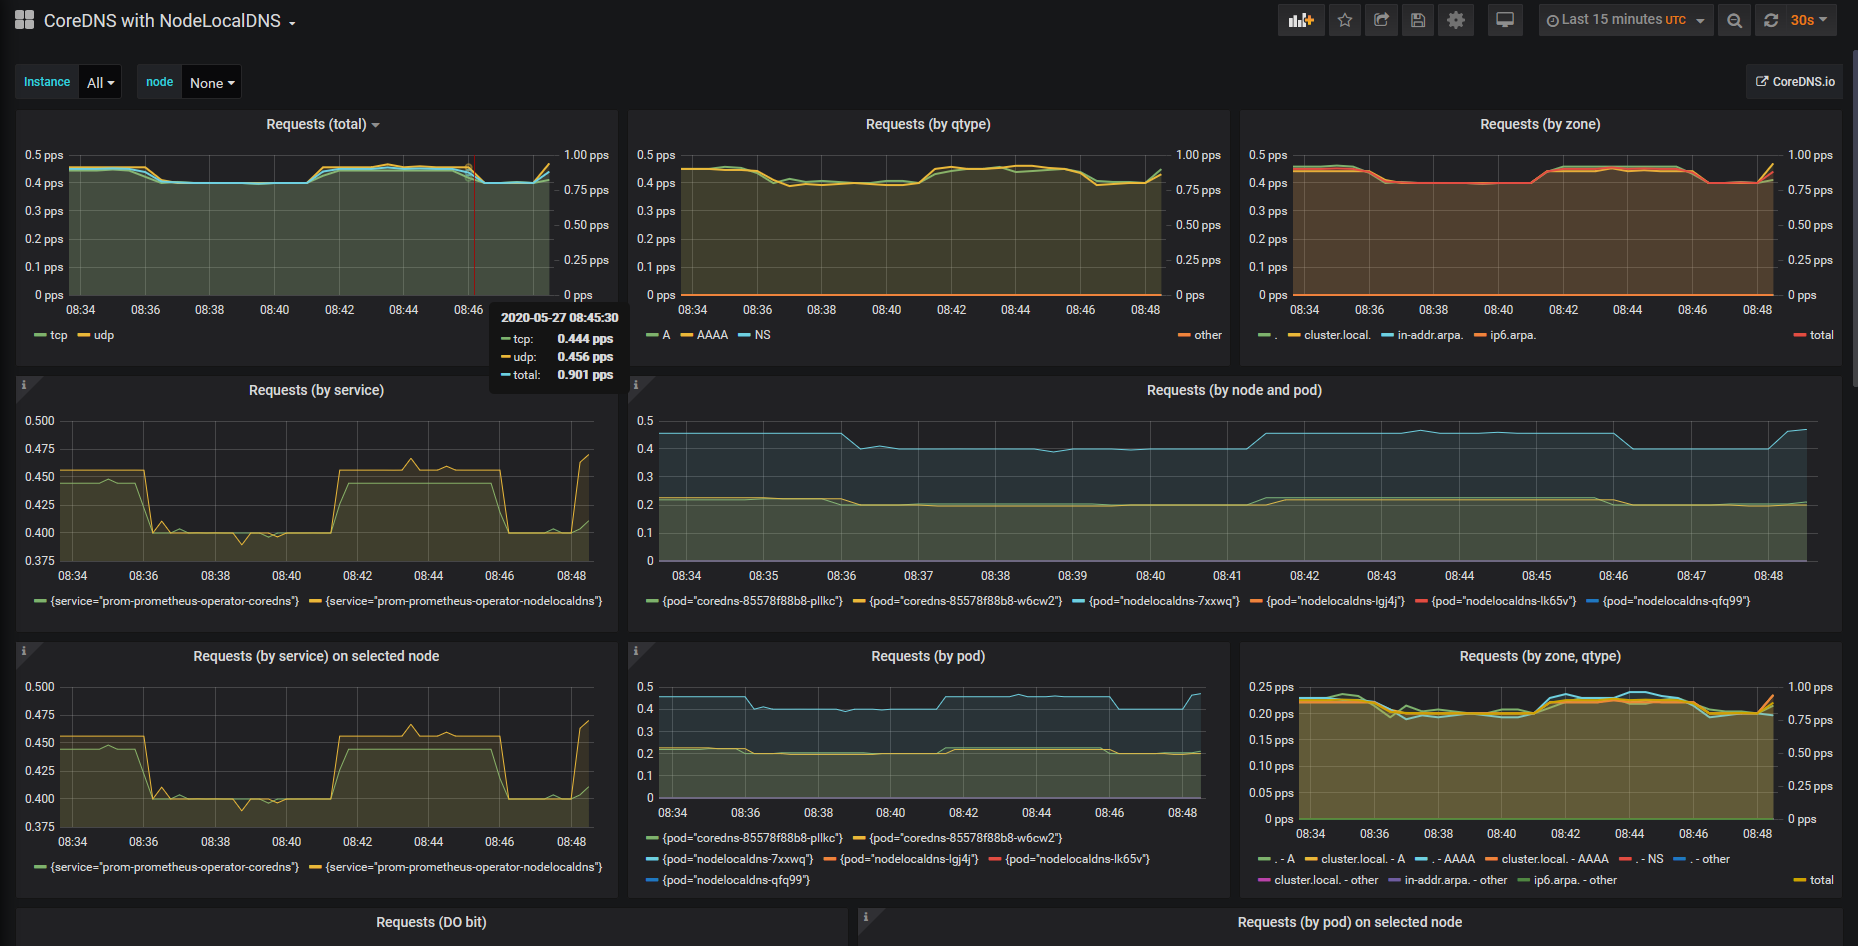
NodeLocalDns 应用监控
# Copyright 2018 The Kubernetes Authors.
#
# Licensed under the Apache License, Version 2.0 (the "License");
# you may not use this file except in compliance with the License.
# You may obtain a copy of the License at
#
#     http://www.apache.org/licenses/LICENSE-2.0
#
# Unless required by applicable law or agreed to in writing, software
# distributed under the License is distributed on an "AS IS" BASIS,
# WITHOUT WARRANTIES OR CONDITIONS OF ANY KIND, either express or implied.
# See the License for the specific language governing permissions and
# limitations under the License.
#

apiVersion: v1
kind: ServiceAccount
metadata:
  name: node-local-dns
  namespace: kube-system
  labels:
    kubernetes.io/cluster-service: "true"
    addonmanager.kubernetes.io/mode: Reconcile
---
apiVersion: v1
kind: Service
metadata:
  name: kube-dns-upstream
  namespace: kube-system
  labels:
    k8s-app: kube-dns
    kubernetes.io/cluster-service: "true"
    addonmanager.kubernetes.io/mode: Reconcile
    kubernetes.io/name: "KubeDNSUpstream"
spec:
  ports:
  - name: dns
    port: 53
    protocol: UDP
    targetPort: 53
  - name: dns-tcp
    port: 53
    protocol: TCP
    targetPort: 53
  selector:
    k8s-app: kube-dns
---
apiVersion: v1
kind: ConfigMap
metadata:
  name: node-local-dns
  namespace: kube-system
  labels:
    addonmanager.kubernetes.io/mode: Reconcile
data:
  Corefile: |
    __PILLAR__DNS__DOMAIN__:53 {
        errors
        cache {
                success 9984 30
                denial 9984 5
        }
        reload
        loop
        bind __PILLAR__LOCAL__DNS__ __PILLAR__DNS__SERVER__
        forward . __PILLAR__CLUSTER__DNS__ {
                force_tcp
        }
        prometheus :9253
        health __PILLAR__LOCAL__DNS__:8080
        }
    in-addr.arpa:53 {
        errors
        cache 30
        reload
        loop
        bind __PILLAR__LOCAL__DNS__ __PILLAR__DNS__SERVER__
        forward . __PILLAR__CLUSTER__DNS__ {
                force_tcp
        }
        prometheus :9253
        }
    ip6.arpa:53 {
        errors
        cache 30
        reload
        loop
        bind __PILLAR__LOCAL__DNS__ __PILLAR__DNS__SERVER__
        forward . __PILLAR__CLUSTER__DNS__ {
                force_tcp
        }
        prometheus :9253
        }
    .:53 {
        errors
        cache 30
        reload
        loop
        bind __PILLAR__LOCAL__DNS__ __PILLAR__DNS__SERVER__
        forward . __PILLAR__UPSTREAM__SERVERS__ {
                force_tcp
        }
        prometheus :9253
        }
---
apiVersion: apps/v1
kind: DaemonSet
metadata:
  name: node-local-dns
  namespace: kube-system
  labels:
    k8s-app: node-local-dns
    kubernetes.io/cluster-service: "true"
    addonmanager.kubernetes.io/mode: Reconcile
spec:
  updateStrategy:
    rollingUpdate:
      maxUnavailable: 10%
  selector:
    matchLabels:
      k8s-app: node-local-dns
  template:
    metadata:
      labels:
        k8s-app: node-local-dns
      annotations:
        prometheus.io/port: "9253"
        prometheus.io/port: "9353"
        prometheus.io/scrape: "true"
    spec:
      priorityClassName: system-node-critical
      serviceAccountName: node-local-dns
      hostNetwork: true
      dnsPolicy: Default  # Don't use cluster DNS.
      tolerations:
      - key: "CriticalAddonsOnly"
        operator: "Exists"
      - effect: "NoExecute"
        operator: "Exists"
      - effect: "NoSchedule"
        operator: "Exists"
      containers:
      - name: node-cache
        image: k8s.gcr.io/k8s-dns-node-cache:1.15.13
        resources:
          requests:
            cpu: 25m
            memory: 5Mi
        args: [ "-localip", "__PILLAR__LOCAL__DNS__,__PILLAR__DNS__SERVER__", "-conf", "/etc/Corefile", "-upstreamsvc", "kube-dns-upstream" ]
        securityContext:
          privileged: true
        ports:
        - containerPort: 53
          name: dns
          protocol: UDP
        - containerPort: 53
          name: dns-tcp
          protocol: TCP
        - containerPort: 9253
          name: metrics
          protocol: TCP
        - containerPort: 9353
          name: setup-metrics
          protocol: TCP
        livenessProbe:
          httpGet:
            host: __PILLAR__LOCAL__DNS__
            path: /health
            port: 8080
          initialDelaySeconds: 60
          timeoutSeconds: 5
        volumeMounts:
        - mountPath: /run/xtables.lock
          name: xtables-lock
          readOnly: false
        - name: config-volume
          mountPath: /etc/coredns
        - name: kube-dns-config
          mountPath: /etc/kube-dns
      volumes:
      - name: xtables-lock
        hostPath:
          path: /run/xtables.lock
          type: FileOrCreate
      - name: kube-dns-config
        configMap:
          name: kube-dns
          optional: true
      - name: config-volume
        configMap:
          name: node-local-dns
          items:
            - key: Corefile
              path: Corefile.base
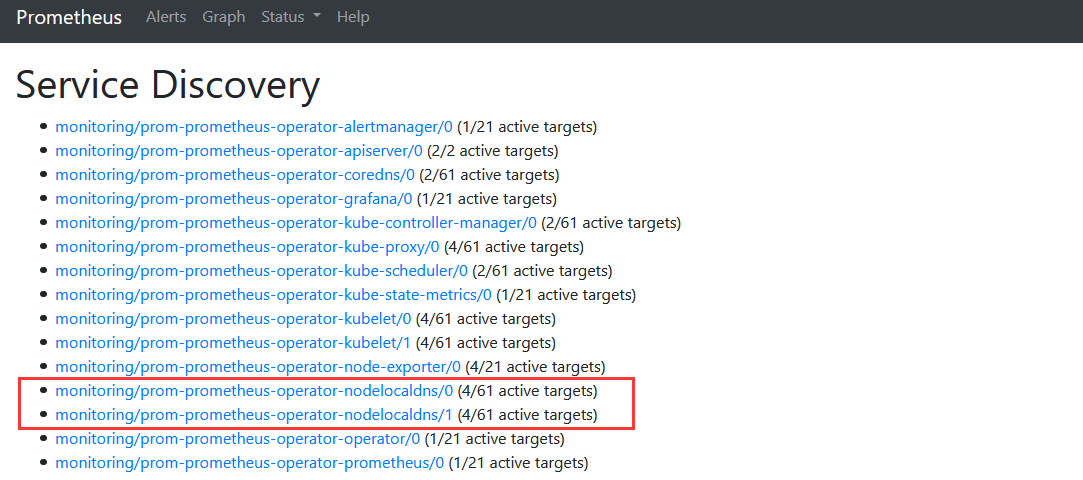
创建Service
apiVersion: v1
kind: Service
metadata:
  labels:
    app: prometheus-operator-nodelocaldns
    release: prom
    jobLabel: nodelocaldns
  name: prom-prometheus-operator-nodelocaldns
  namespace: kube-system
spec:
  clusterIP: None
  ports:
  - name: metrics
    port: 9253
    protocol: TCP
    targetPort: 9253
  - name: setup-metrics
    port: 9353
    protocol: TCP
    targetPort: 9353
  selector:
    k8s-app: node-local-dns
  sessionAffinity: None
  type: ClusterIP
status:
  loadBalancer: {}
创建serviceMonitor
apiVersion: monitoring.coreos.com/v1
kind: ServiceMonitor
metadata:
  labels:
    app: prometheus-operator-nodelocaldns
    release: prom
  name: prom-prometheus-operator-nodelocaldns
  namespace: monitoring
spec:
  endpoints:
  - port: metrics
    interval: 15s
  - port: setup-metrics
    interval: 15s
  namespaceSelector:
    matchNames:
    - kube-system
  jobLabel: jobLabel
  selector:
    matchLabels:
      app: prometheus-operator-nodelocaldns
      release: prom
创建PrometheusRule
apiVersion: monitoring.coreos.com/v1
kind: PrometheusRule
metadata:
  annotations:
    prometheus-operator-validated: "true"
  labels:
    app: prometheus-operator
    chart: prometheus-operator-8.12.13
    heritage: Helm
    release: prom
  name: prom-prometheus-operator-nodelocaldns
  namespace: monitoring
spec:
  groups:
  - name: nodelocaldns
    rules:
    - alert: NodeLocalDNSMetricsDown
      annotations:
        message: Node Local DNS has disappeared from Prometheus target discovery.
        runbook_url: https://github.com/povilasv/coredns-mixin/tree/master/runbook.md#alert-name-nodelocaldnsmetricsdown
      expr: |
        absent(up{job="nodelocaldns"} == 1)
      for: 2m
      labels:
        severity: critical
    - alert: NodeLocalDNSSetupErrorsHigh
      annotations:
        message: There are  errors setting up Node Local DNS.
        runbook_url: https://github.com/povilasv/coredns-mixin/tree/master/runbook.md#alert-name-nodelocaldnssetuperrorshigh
      expr: |
        rate(coredns_nodecache_setup_errors{job="nodelocaldns"}[5m]) > 0
      for: 2m
      labels:
        severity: critical
  - name: coredns
    rules:
    - alert: NodeLocalDNSDown
      annotations:
        message: NodeLocalDNS has disappeared from Prometheus target discovery.
        runbook_url: https://github.com/povilasv/coredns-mixin/tree/master/runbook.md#alert-name-corednsdown
      expr: |
        absent(up{job="nodelocaldns"} == 1)
      for: 15m
      labels:
        severity: critical
    - alert: NodeLocalDNSLatencyHigh
      annotations:
        message: NodeLocalDNS has 99th percentile latency of  seconds for
          server  zone  .
        runbook_url: https://github.com/povilasv/coredns-mixin/tree/master/runbook.md#alert-name-corednslatencyhigh
      expr: |
        histogram_quantile(0.99, sum(rate(coredns_dns_request_duration_seconds_bucket{job="nodelocaldns"}[5m])) without(instance, pod)) > 4
      for: 10m
      labels:
        severity: critical
    - alert: NodeLocalDNSErrorsHigh
      annotations:
        message: NodeLocalDNS is returning SERVFAIL for  of requests.
        runbook_url: https://github.com/povilasv/coredns-mixin/tree/master/runbook.md#alert-name-corednserrorshigh
      expr: |
        sum(rate(coredns_dns_response_rcode_count_total{job="nodelocaldns",rcode="SERVFAIL"}[5m]))
          /
        sum(rate(coredns_dns_response_rcode_count_total{job="nodelocaldns"}[5m])) > 0.03
      for: 10m
      labels:
        severity: critical
    - alert: NodeLocalDNSErrorsHigh
      annotations:
        message: NodeLocalDNS is returning SERVFAIL for  of requests.
        runbook_url: https://github.com/povilasv/coredns-mixin/tree/master/runbook.md#alert-name-corednserrorshigh
      expr: |
        sum(rate(coredns_dns_response_rcode_count_total{job="nodelocaldns",rcode="SERVFAIL"}[5m]))
          /
        sum(rate(coredns_dns_response_rcode_count_total{job="nodelocaldns"}[5m])) > 0.01
      for: 10m
      labels:
        severity: warning
  - name: coredns_forward
    rules:
    - alert: NodeLocalDNSForwardLatencyHigh
      annotations:
        message: NodeLocalDNS has 99th percentile latency of  seconds forwarding
          requests to .
        runbook_url: https://github.com/povilasv/coredns-mixin/tree/master/runbook.md#alert-name-corednsforwardlatencyhigh
      expr: |
        histogram_quantile(0.99, sum(rate(coredns_forward_request_duration_seconds_bucket{job="nodelocaldns"}[5m])) without(instance, pod)) > 4
      for: 10m
      labels:
        severity: critical
    - alert: NodeLocalDNSForwardErrorsHigh
      annotations:
        message: NodeLocalDNS is returning SERVFAIL for  of forward requests to .
        runbook_url: https://github.com/povilasv/coredns-mixin/tree/master/runbook.md#alert-name-corednsforwarderrorshigh
      expr: |
        sum(rate(coredns_forward_response_rcode_count_total{job="nodelocaldns",rcode="SERVFAIL"}[5m]))
          /
        sum(rate(coredns_forward_response_rcode_count_total{job="nodelocaldns"}[5m])) > 0.03
      for: 10m
      labels:
        severity: critical
    - alert: NodeLocalDNSForwardErrorsHigh
      annotations:
        message: NodeLocalDNS is returning SERVFAIL for  of forward requests to .
        runbook_url: https://github.com/povilasv/coredns-mixin/tree/master/runbook.md#alert-name-corednsforwarderrorshigh
      expr: |
        sum(rate(coredns_dns_response_rcode_count_total{job="nodelocaldns",rcode="SERVFAIL"}[5m]))
          /
        sum(rate(coredns_dns_response_rcode_count_total{job="nodelocaldns"}[5m])) > 0.01
      for: 10m
      labels:
        severity: warning
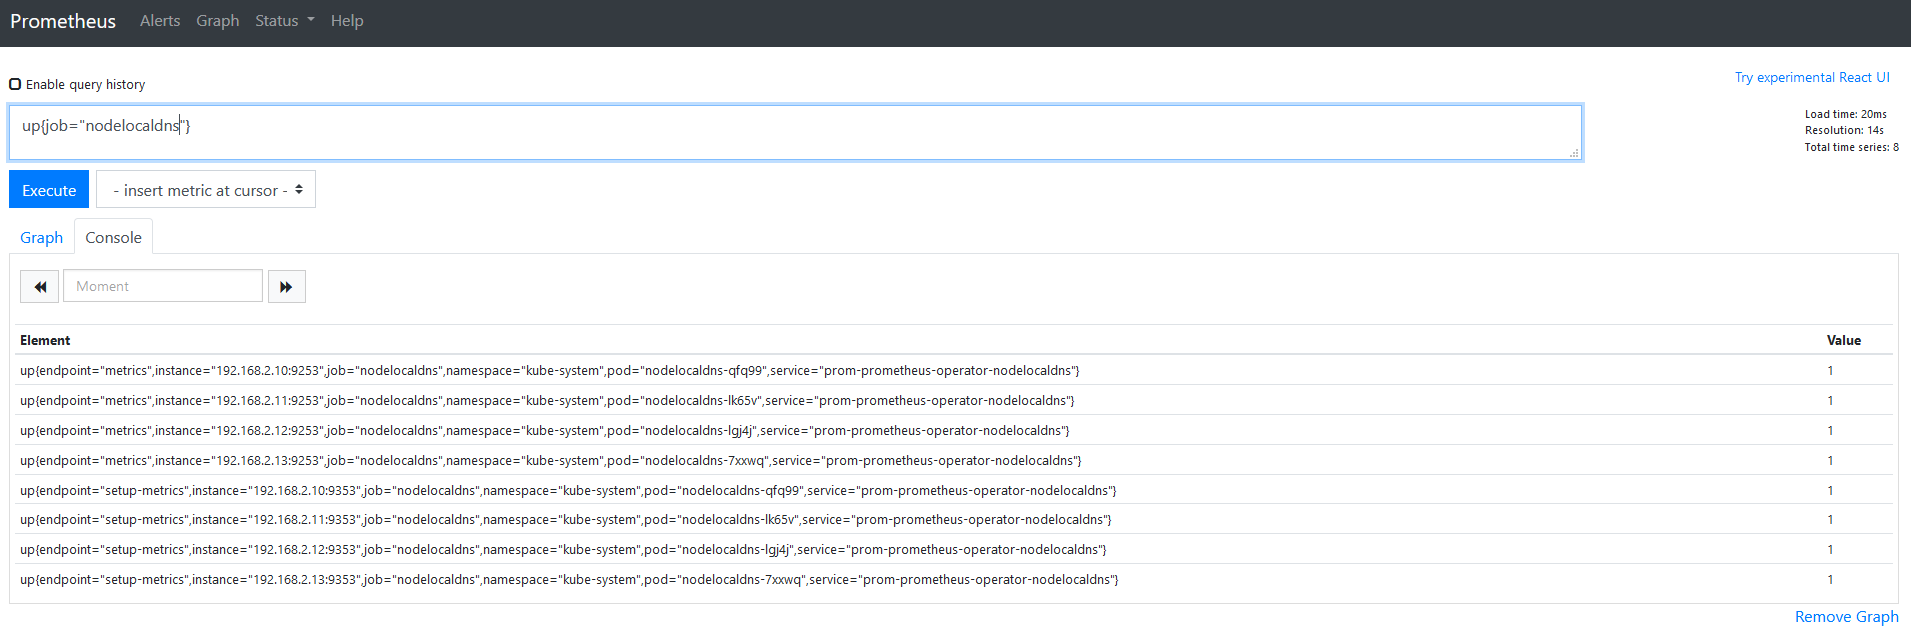
验证: